Are small-cap stocks signaling a bear market?
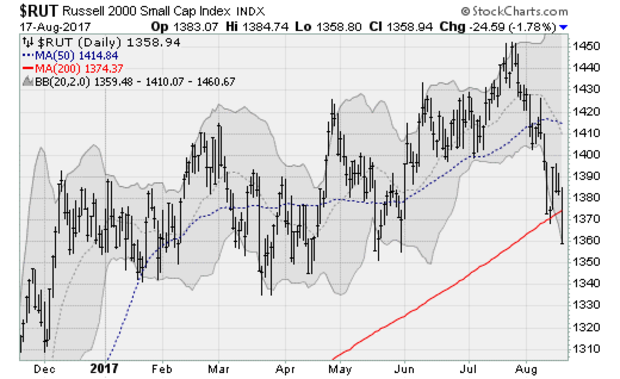
Thursday's U.S. stock market plunge pushed the Russell 2000 small-cap index below its 200-day moving average, a feat that hasn't occurred since June 2016.
The bigger question could be whether it set the stage for the first major selloff in more than a year.
The rout was the combination of the release of rather hawkish Federal Reserve meeting minutes on Wednesday and the political blowback from President Trump's stance on "both sides" being to blame in the wake of last week's violence in Charlottesville that has investors worried.
Also weighing on investor sentiment are reports that top White House economic advisor Gary Cohn -- seen as a moderate to populist firebrand advisor Steve Bannon -- could be on the verge of stepping down and the deadly terror attacks in Spain.
On a technical basis, the selloff is threatening to break down and out of an epic four-month consolidation range for most stocks. This would end the historic post-election uptrend. And it could set the stage for the first major selloff in the market in more than a year.
One of the most worrisome dynamics of this uptrend has been its narrowness. Measures of market breadth have tightened notably in recent weeks, resulting in a large cluster of "Hindenburg Omen" signals on the major averages not seen since the last bull market was peaking. This technical phenomenon -- named after the German airship destroyed in a fiery disaster in 1937 -- happens when a growing number of stocks hit new 52-week lows while other shares are trading near new highs.
Take the "FAANGs" stocks, a small group of glamourous big-tech stocks that carried the major averages higher on account of their large market capitalization. In the last few days, investors have narrowed their focus on Apple (AAPL). As a result, as the regular market-cap weighted Nasdaq hit new highs, the First Trust NASDAQ-100 Equal Weighted Index Fund ETF (QQEW) floundered in the middle of a four-month trading range.
The Russell 2000 didn't wait around, however, and has sliced through its 200-day average to put the entire post-election uptrend at risk. That's the first move below this widely followed measure in more than a year, one of the longest runs on record at 286 days.
A prior run of 363 days ended in 2014. In the last bull market, there was only a single form of this type of persistence, and it ended after just 267 days.
A move below the 200-day average is widely viewed as signalling a new downtrend or "bear market," which describes a decline of 20 percent or more. (Animal euphemisms aren't precise.)
At the same time, the widely followed Dow Jones Industrial Average remains more than five percent above its own 200-day average. Just another example of the "stock market" being far from homogenous, but vastly different depending on what sub-group you use to measure its health.